Tutorial — Data binding
This walks through the data-binding demo end to end: a single dashboard .riv whose title, tickers and numbers are your data, not baked into the file. By the end you'll know where the property names come from and exactly how to set them in UnysonPlus.
The idea in one line
A Rive file can expose named View-Model properties (Rive's data binding). This element writes your values into them at load, so one designed file renders any data.
Step 1 — A .riv with a View Model
Data binding is set up in the Rive editor, by whoever designs the file: the Data panel defines a View Model — a named list of properties, each with a type:
| Rive type | Use it for |
|---|---|
| String | a label, a name, a title |
| Number | a count, a percentage, a value that drives a bar/needle |
| Boolean | an on/off / show-hide state |
| Color | a fill you want themeable |
| Enum | one of a fixed set of named states |
| Trigger | a one-shot signal (fire an animation / reset a view) |
Properties can be nested: a View Model can contain another View Model, which is how a list of items (rows in a dashboard, cards in a carousel) is modelled.
You need two things from the file: the exact property names and their types. Open the file's Data panel in Rive, or ask your designer.
The demo file. The demo uses a Rive-provided stock-dashboard example. Its View Model exposes a
title(string), a themerootColor(color), and three nested items — each with aname(string), astockChange(number that drives the bar height + up/down colour) and acurrentColor(color). We simply rebind those to our own values.
Step 2 — Add the element
Builder palette → Animation Engine → Rive Animation. On the Animation tab, upload the .riv (or paste a URL), and enter the State Machine name so the file runs.
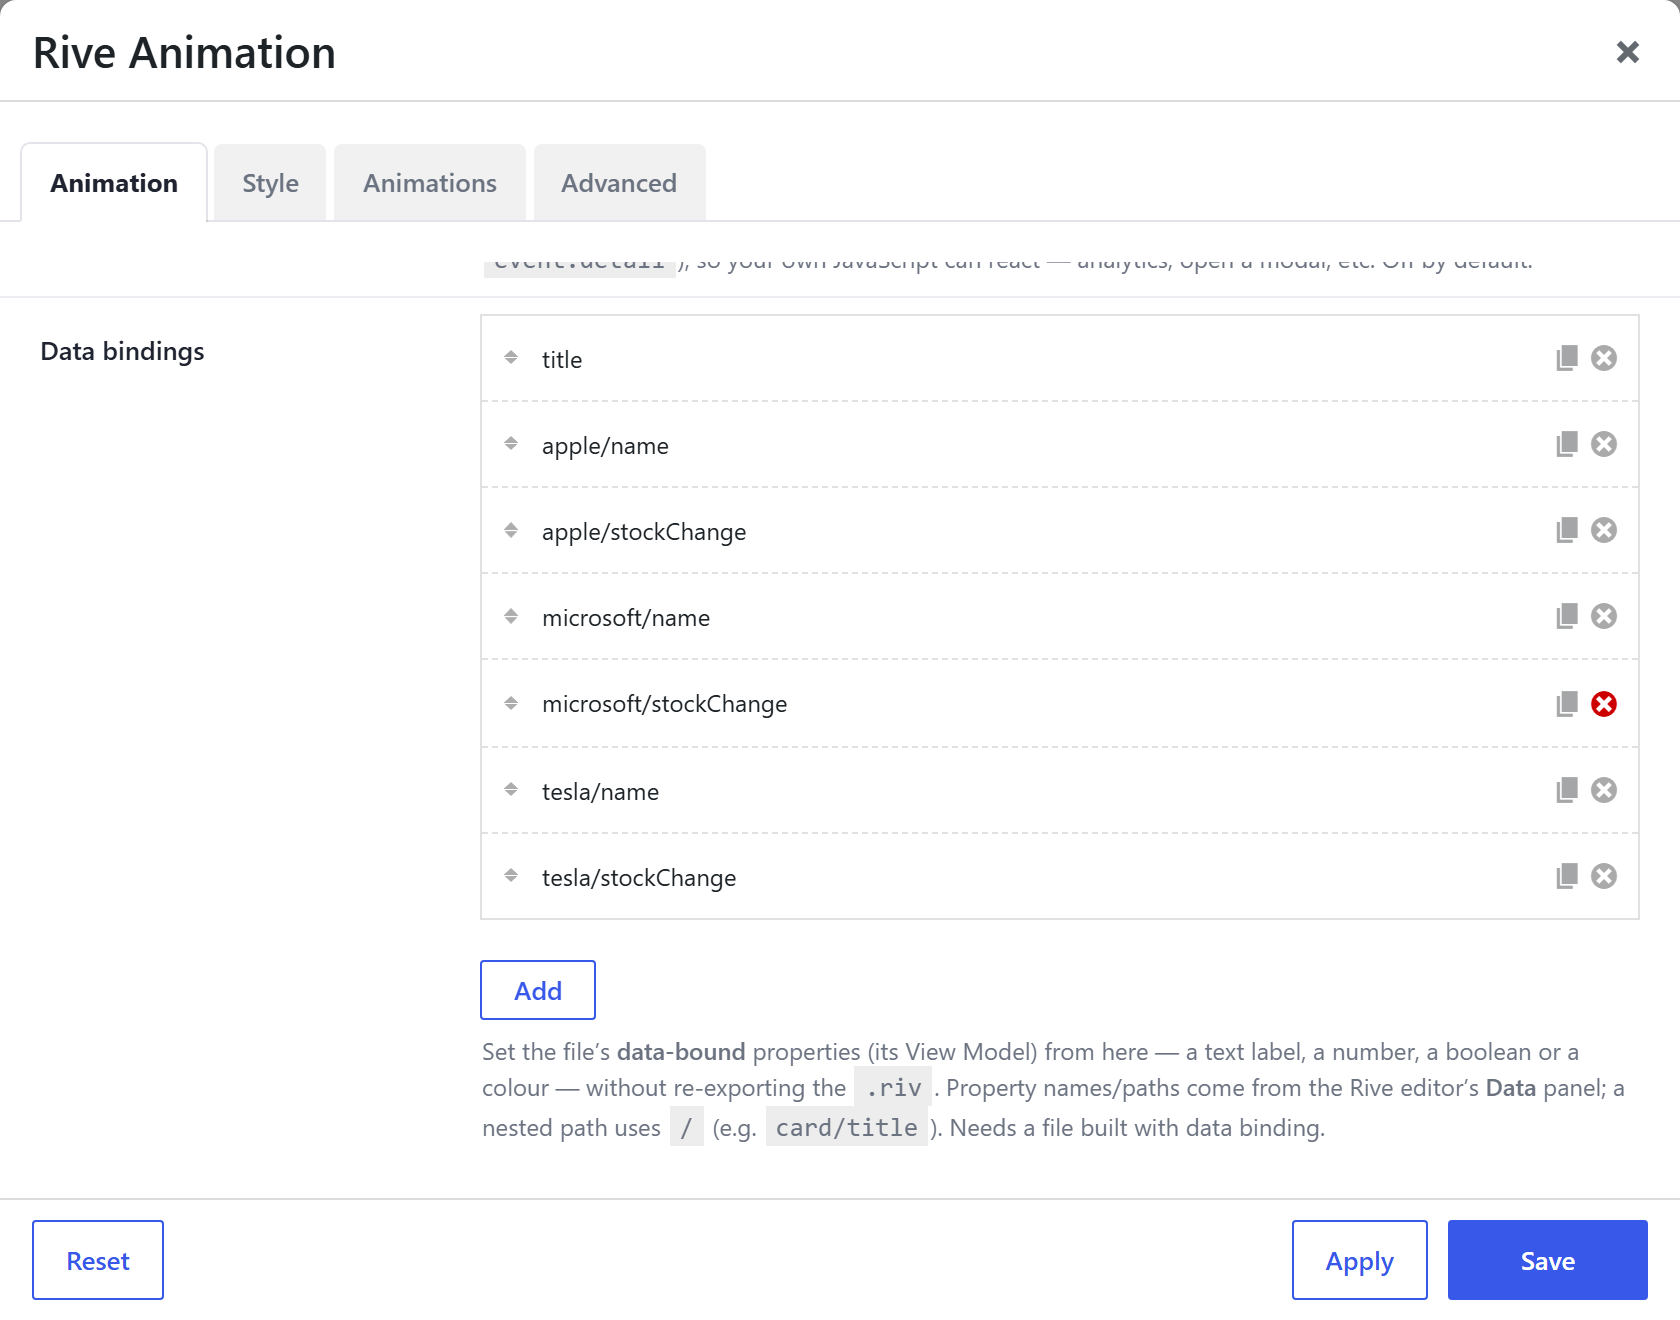
Step 3 — Add the Data bindings
Still on the Animation tab, open Data bindings and add one row per property you want to set:
| Field | What to enter |
|---|---|
| Property name / path | The View-Model property. For a nested one, join with / — e.g. item/name. |
| Type | Match the property's Rive type: Text · Number · Boolean · Colour · Enum · Trigger. |
| Value | The value (a hex like #00b295 for Colour; leave empty for Trigger). |
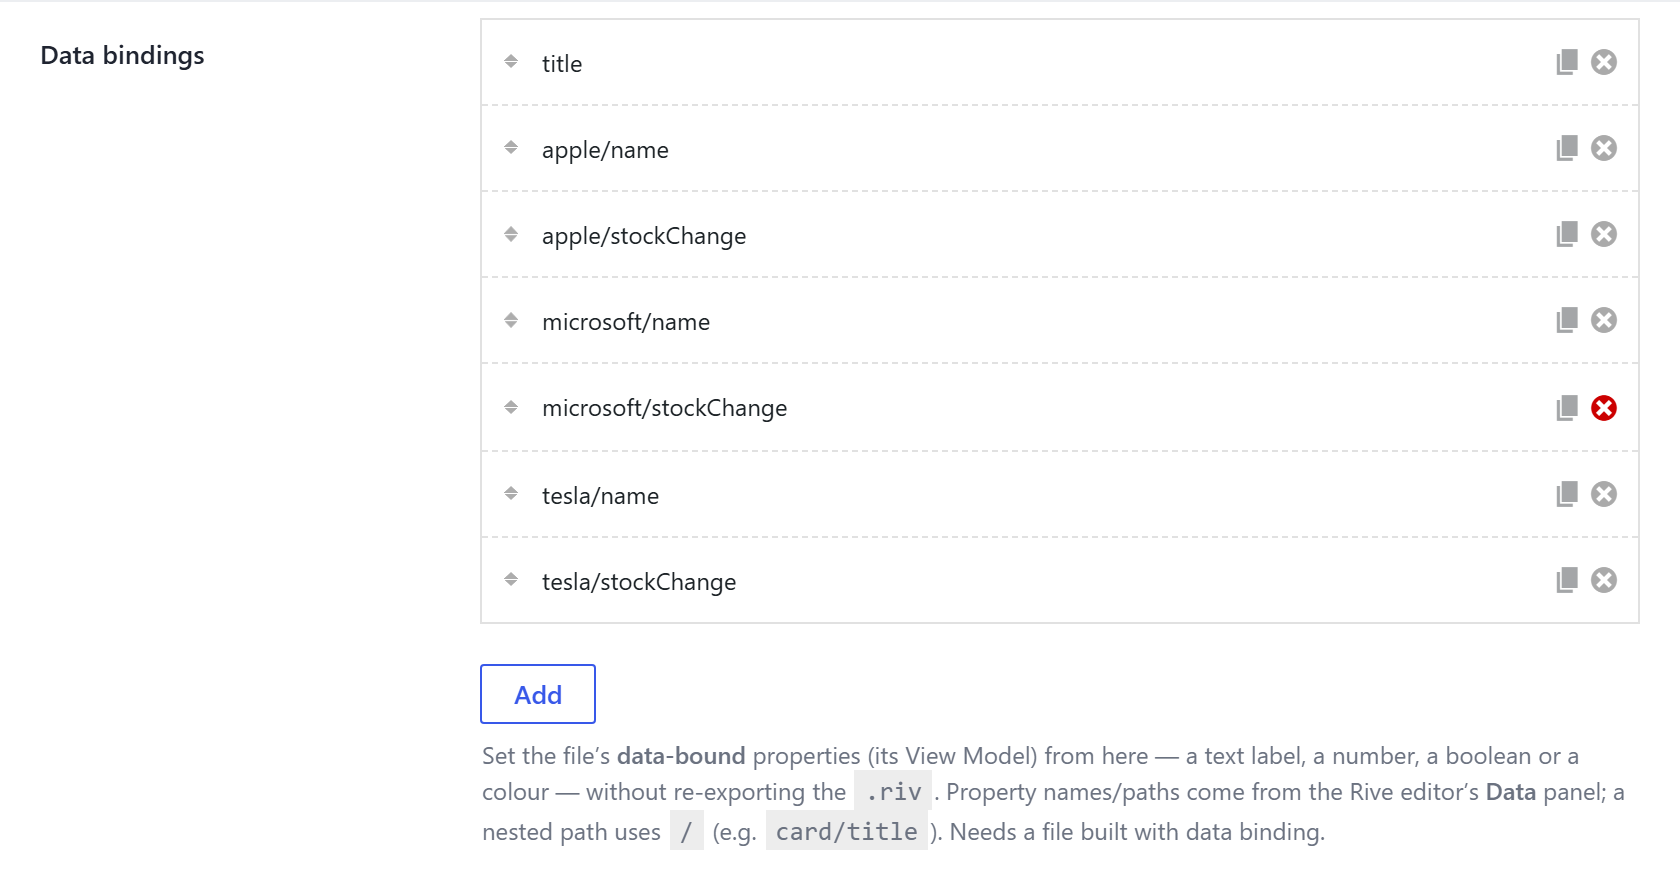
For the dashboard demo, the rows are:
| Property / path | Type | Value |
|---|---|---|
title | Text | Live portfolio |
apple/name | Text | NOVA |
apple/stockChange | Number | 128 |
microsoft/name | Text | ORBIT |
microsoft/stockChange | Number | -42 |
tesla/name | Text | ATLAS |
tesla/stockChange | Number | 76 |
apple / microsoft / tesla are just the file's internal slot names for the three items — they're not shown to visitors. The displayed label is the name string you bind, which is why the demo can show NOVA / ORBIT / ATLAS. Point the same slots at your own rows.
Step 4 — Save and view
Save the page and open the front end. The dashboard renders your values, and the bar colour follows the sign of each number automatically (positive = up, negative = down) — because that logic lives inside the .riv; you only supplied the data.
Where the data comes from
In this tutorial the values are static — typed into the builder. That already covers "design once, reuse with different content." To make them live (from your CMS, a REST call, a spreadsheet, a WebSocket) you keep the exact same bindings and push new values at runtime with the JavaScript API:
→ Tutorial — Drive Rive from JavaScript
…or wire a value to the pointer / scroll with no code at all:
→ Tutorial — Pointer & scroll inputs
Tips
- A binding whose property name doesn't exist in the file is skipped silently — safe to leave stray rows.
- Use a Trigger binding (fires once on load, after the value rows) to set an initial state — e.g. reveal a "filled-in" view.
- Needs a
.rivbuilt with data binding. A file with no View Model simply ignores the bindings.