Sales reports
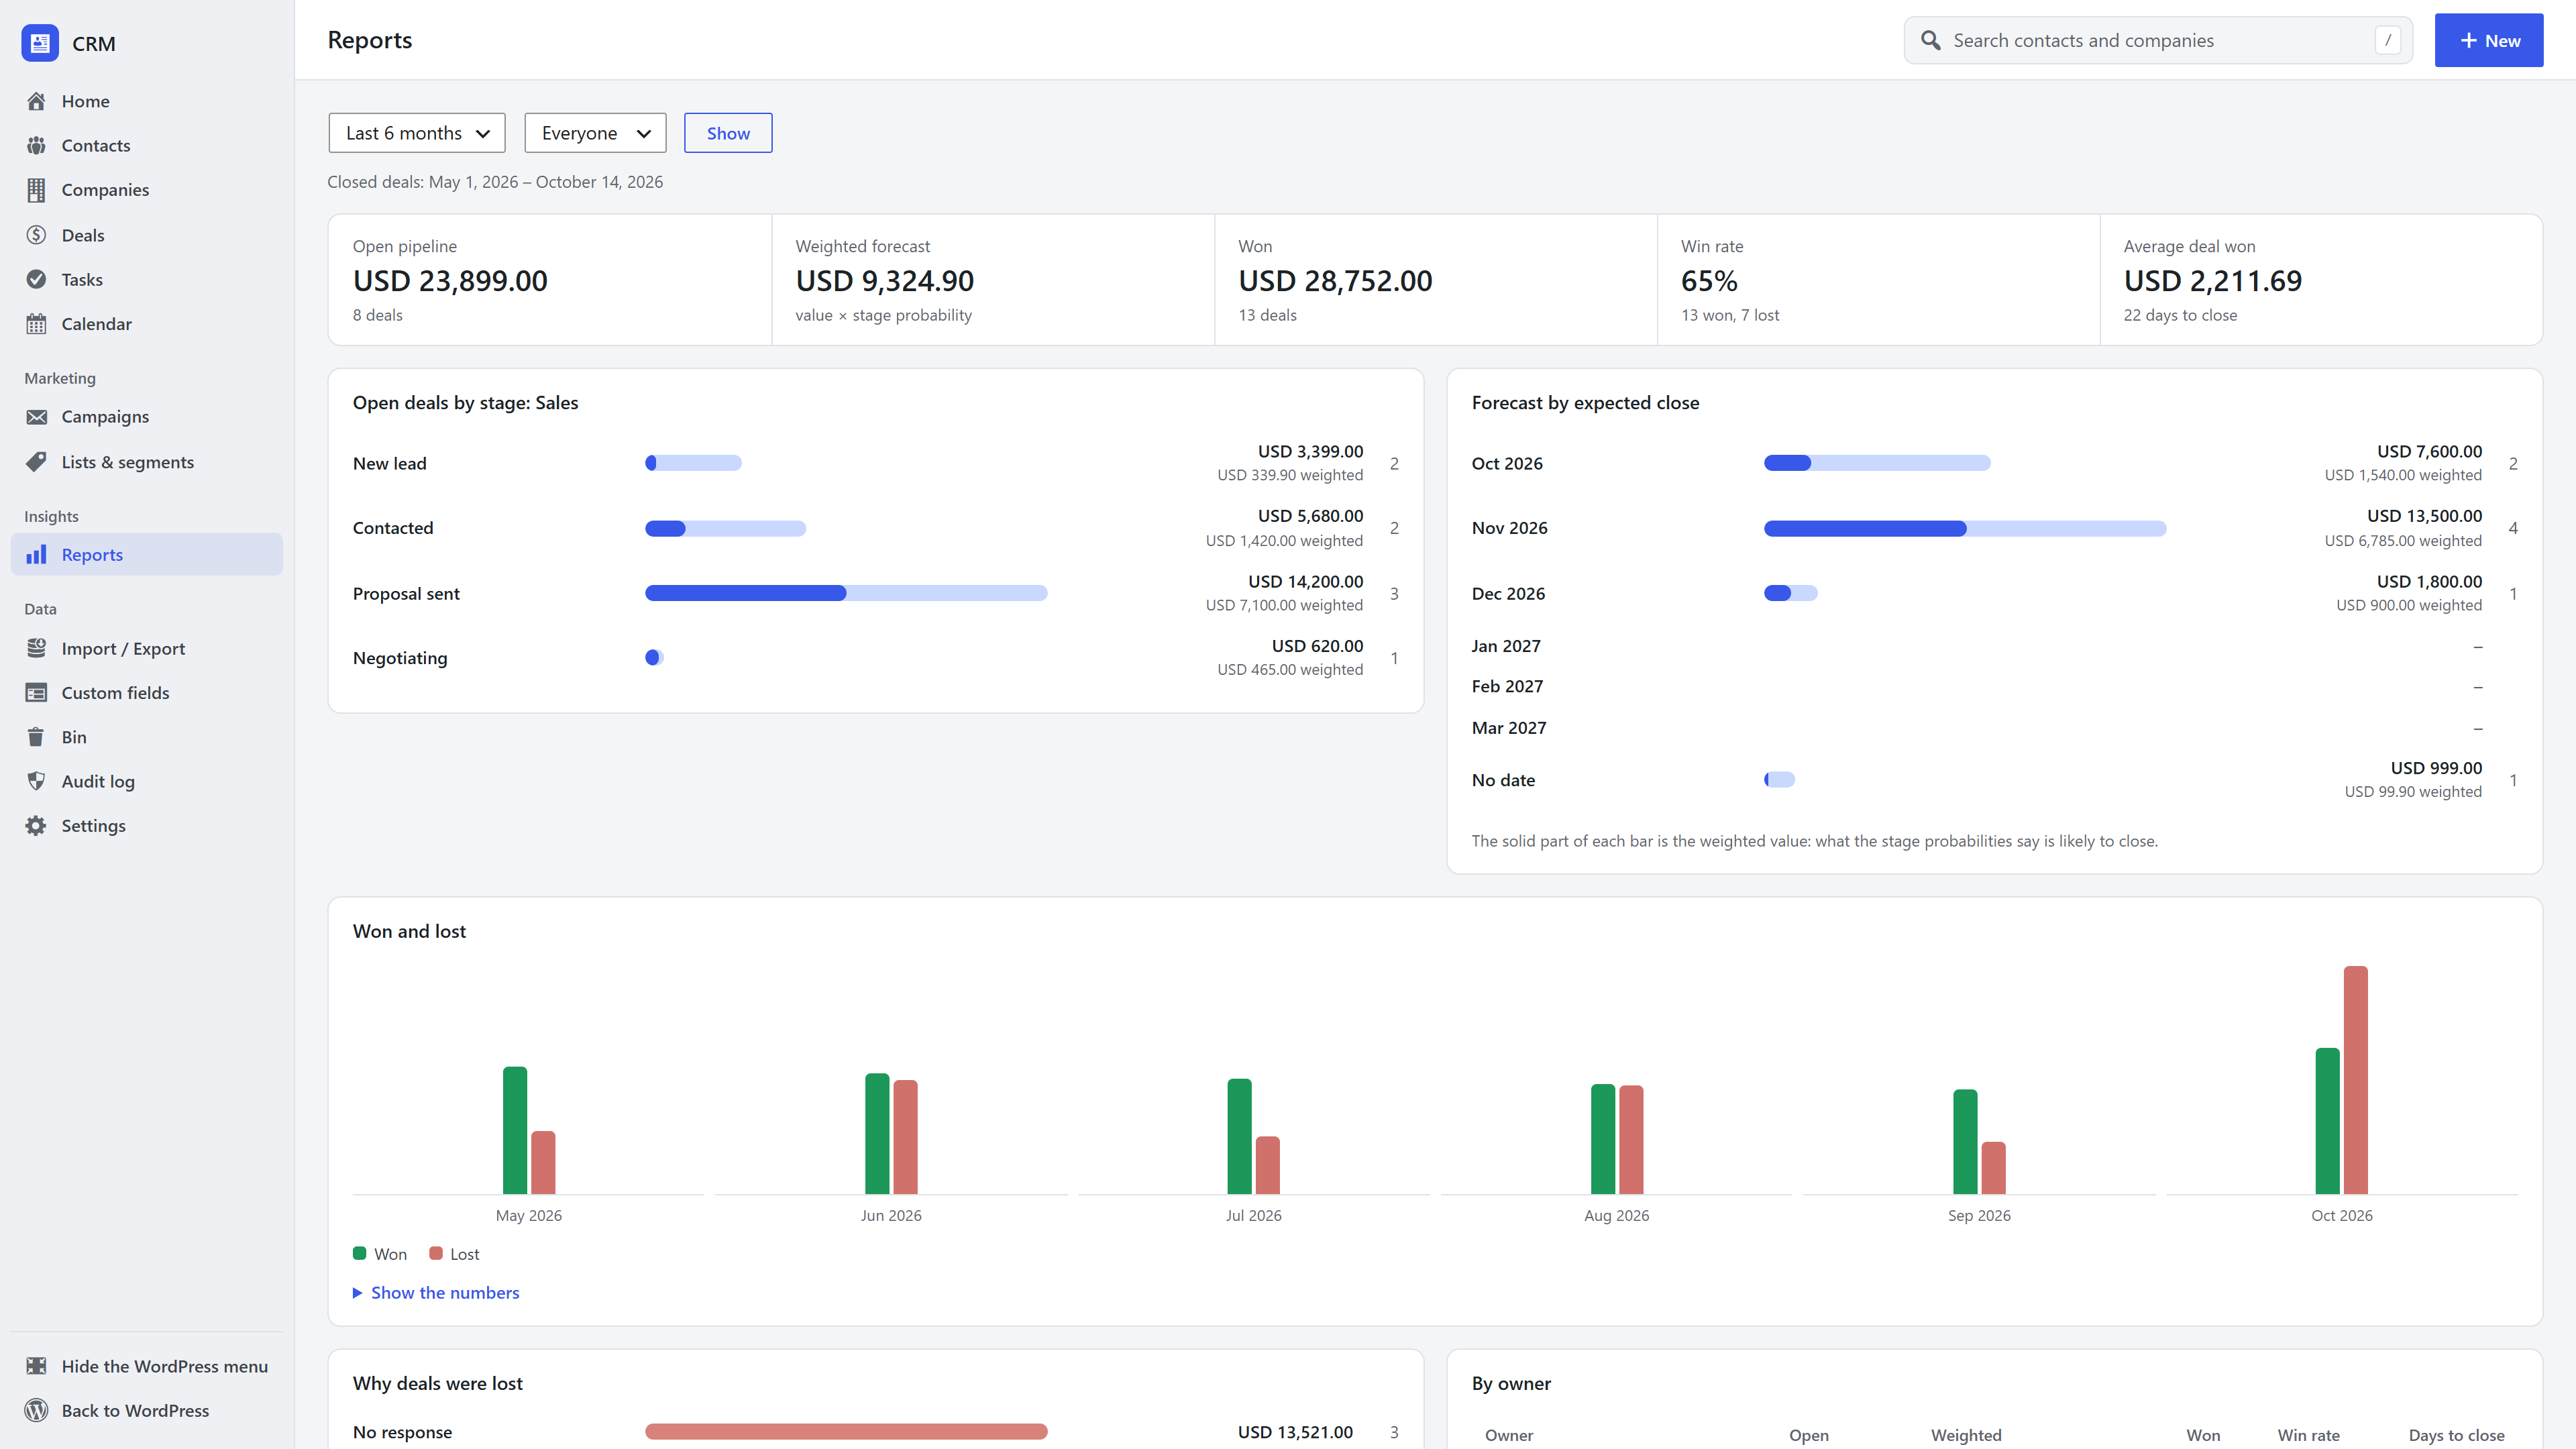
CRM → Reports turns your deals into answers: how much is in the pipeline, what is likely to close and when, how many deals you win, and why you lose the others.
Filters
- Pipeline: one pipeline or all of them.
- Period: this month, the last 3, 6 or 12 months, this year, or custom dates. The period decides which closed deals count; the open pipeline and the forecast are always as of today.
- Owner (managers): everyone, or one person.
What the report shows
| Section | What it tells you |
|---|---|
| Open pipeline | The value and number of open deals |
| Weighted forecast | Open value × each stage's probability: what is realistically likely to close |
| Won | Value and number of deals won in the period |
| Win rate | Won ÷ (won + lost) in the period |
| Average deal won | The typical size of a win, and how many days deals take from created to won |
| Open deals by stage | Where the open value sits, with the weighted part shown solid |
| Forecast by expected close | Open deals by the month they should close, plus those past their date and those with no date |
| Won and lost | Won and lost value per month (with a table of the numbers) |
| Why deals were lost | The lost reasons, most common first |
| By owner | Each person's open pipeline, weighted value, wins, win rate and days to close (managers) |
Sales reps see their own numbers. Deals in the bin are left out.
Frequently asked questions
Why is the weighted forecast lower than the open pipeline? It counts each deal at its chance of closing. A deal in an early stage counts for a small part of its value.
How do I improve the forecast? Keep expected close dates and stages up to date, and set realistic probabilities on your stages under Deals → Edit pipelines.
What about deals in different currencies? Amounts are added up as stored and shown in the pipeline's currency; they are not converted.