Site health
Frustration
Where your site lets people down, per page.
| Signal | What it means |
|---|---|
| Rage click | Three quick clicks in one spot. Something did not respond the way the visitor expected. |
| Dead click | A click on something that looks clickable, where nothing happened within 2.5 seconds. |
| Error click | A click followed by a script error within a second. |
The view also lists:
- Script errors, grouped by message. Email addresses, long numbers and query strings are removed in the visitor's browser before anything is sent, so a message cannot carry personal data.
- Missing pages (404), with where visitors came from. Links marked as internal are broken links on
your own site, and those are the ones to fix first. Automated probing (
.php,.env, backups) is left out.
Each signal has its own switch under Settings → Modules.
Performance
Core Web Vitals measured in your real visitors' browsers, per device, page and content type. It reports the 75th percentile, the figure search engines use: three visitors in four had this experience or better.
| Metric | Measures | Good | Poor |
|---|---|---|---|
| LCP | Loading: when the main content appears | up to 2.5 s | over 4 s |
| INP | Responsiveness: the delay after a click or tap | up to 200 ms | over 500 ms |
| CLS | Visual stability: how much the page jumps | up to 0.1 | over 0.25 |
| TTFB | Server response | up to 0.8 s | over 1.8 s |
Unlike a lab test, these figures reflect real devices and connections, so mobile usually looks worse than your own computer does. Start with the worst page that has real traffic.
Bots
How much of your traffic is automated, and which bots they were, next to the human page views.
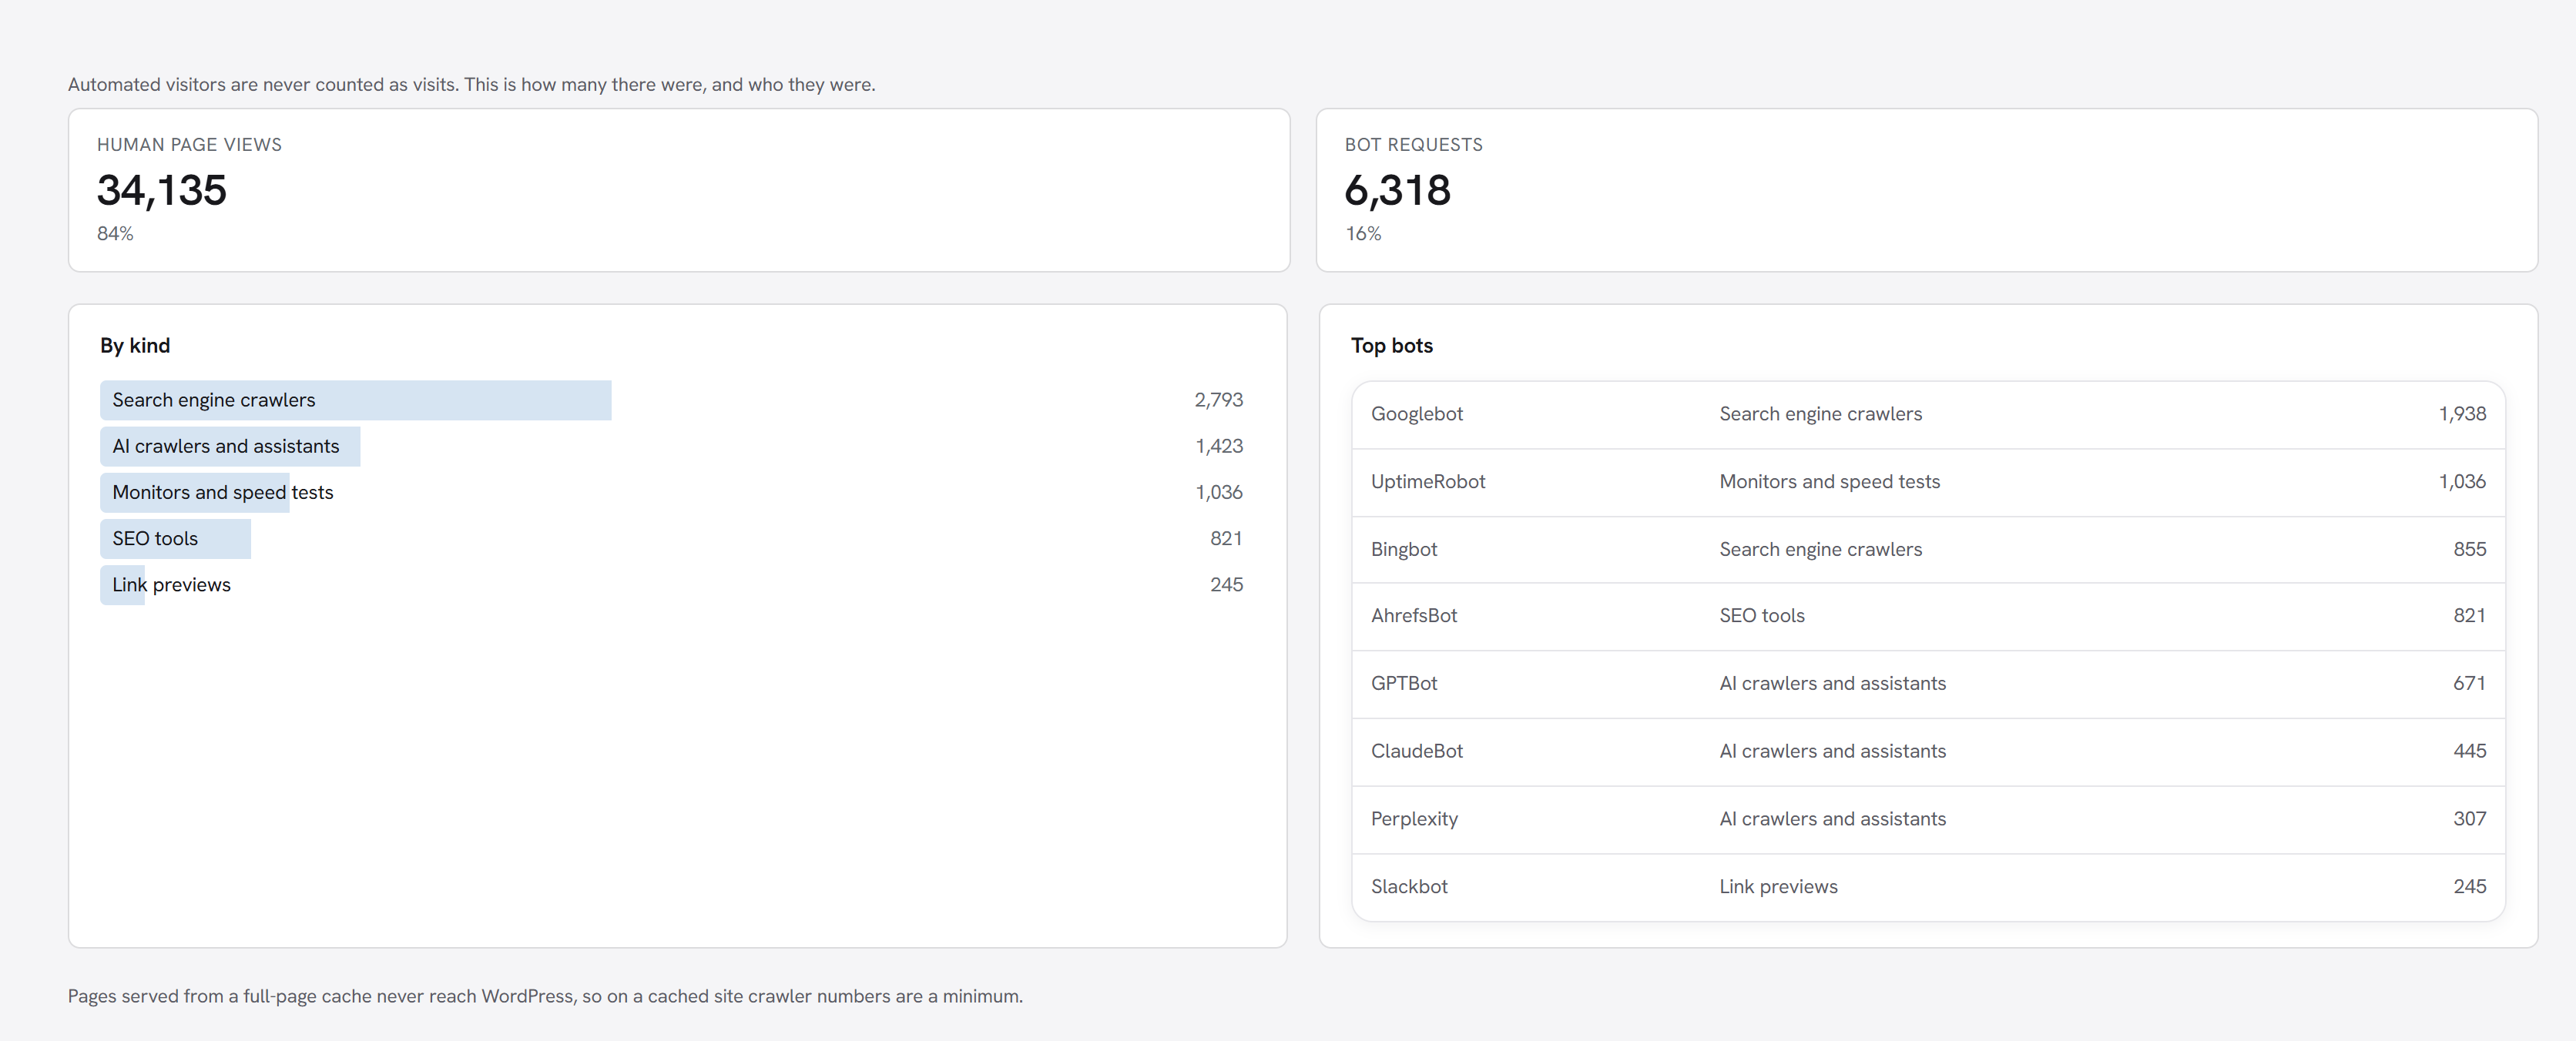
Bots are grouped into search engine crawlers, AI crawlers and assistants, SEO tools, link previews, monitors and speed tests, scripts and headless browsers, and other bots. They are never counted as visits.
On a site with a full-page cache, cached pages never reach WordPress, so crawler numbers are a minimum. Switch it off under Settings → Bot report.