Traffic reports
Overview
The Overview is the summary of the period you chose: page views, unique visitors, average time on page, pages viewed and goal completions, each with its change against the period before.
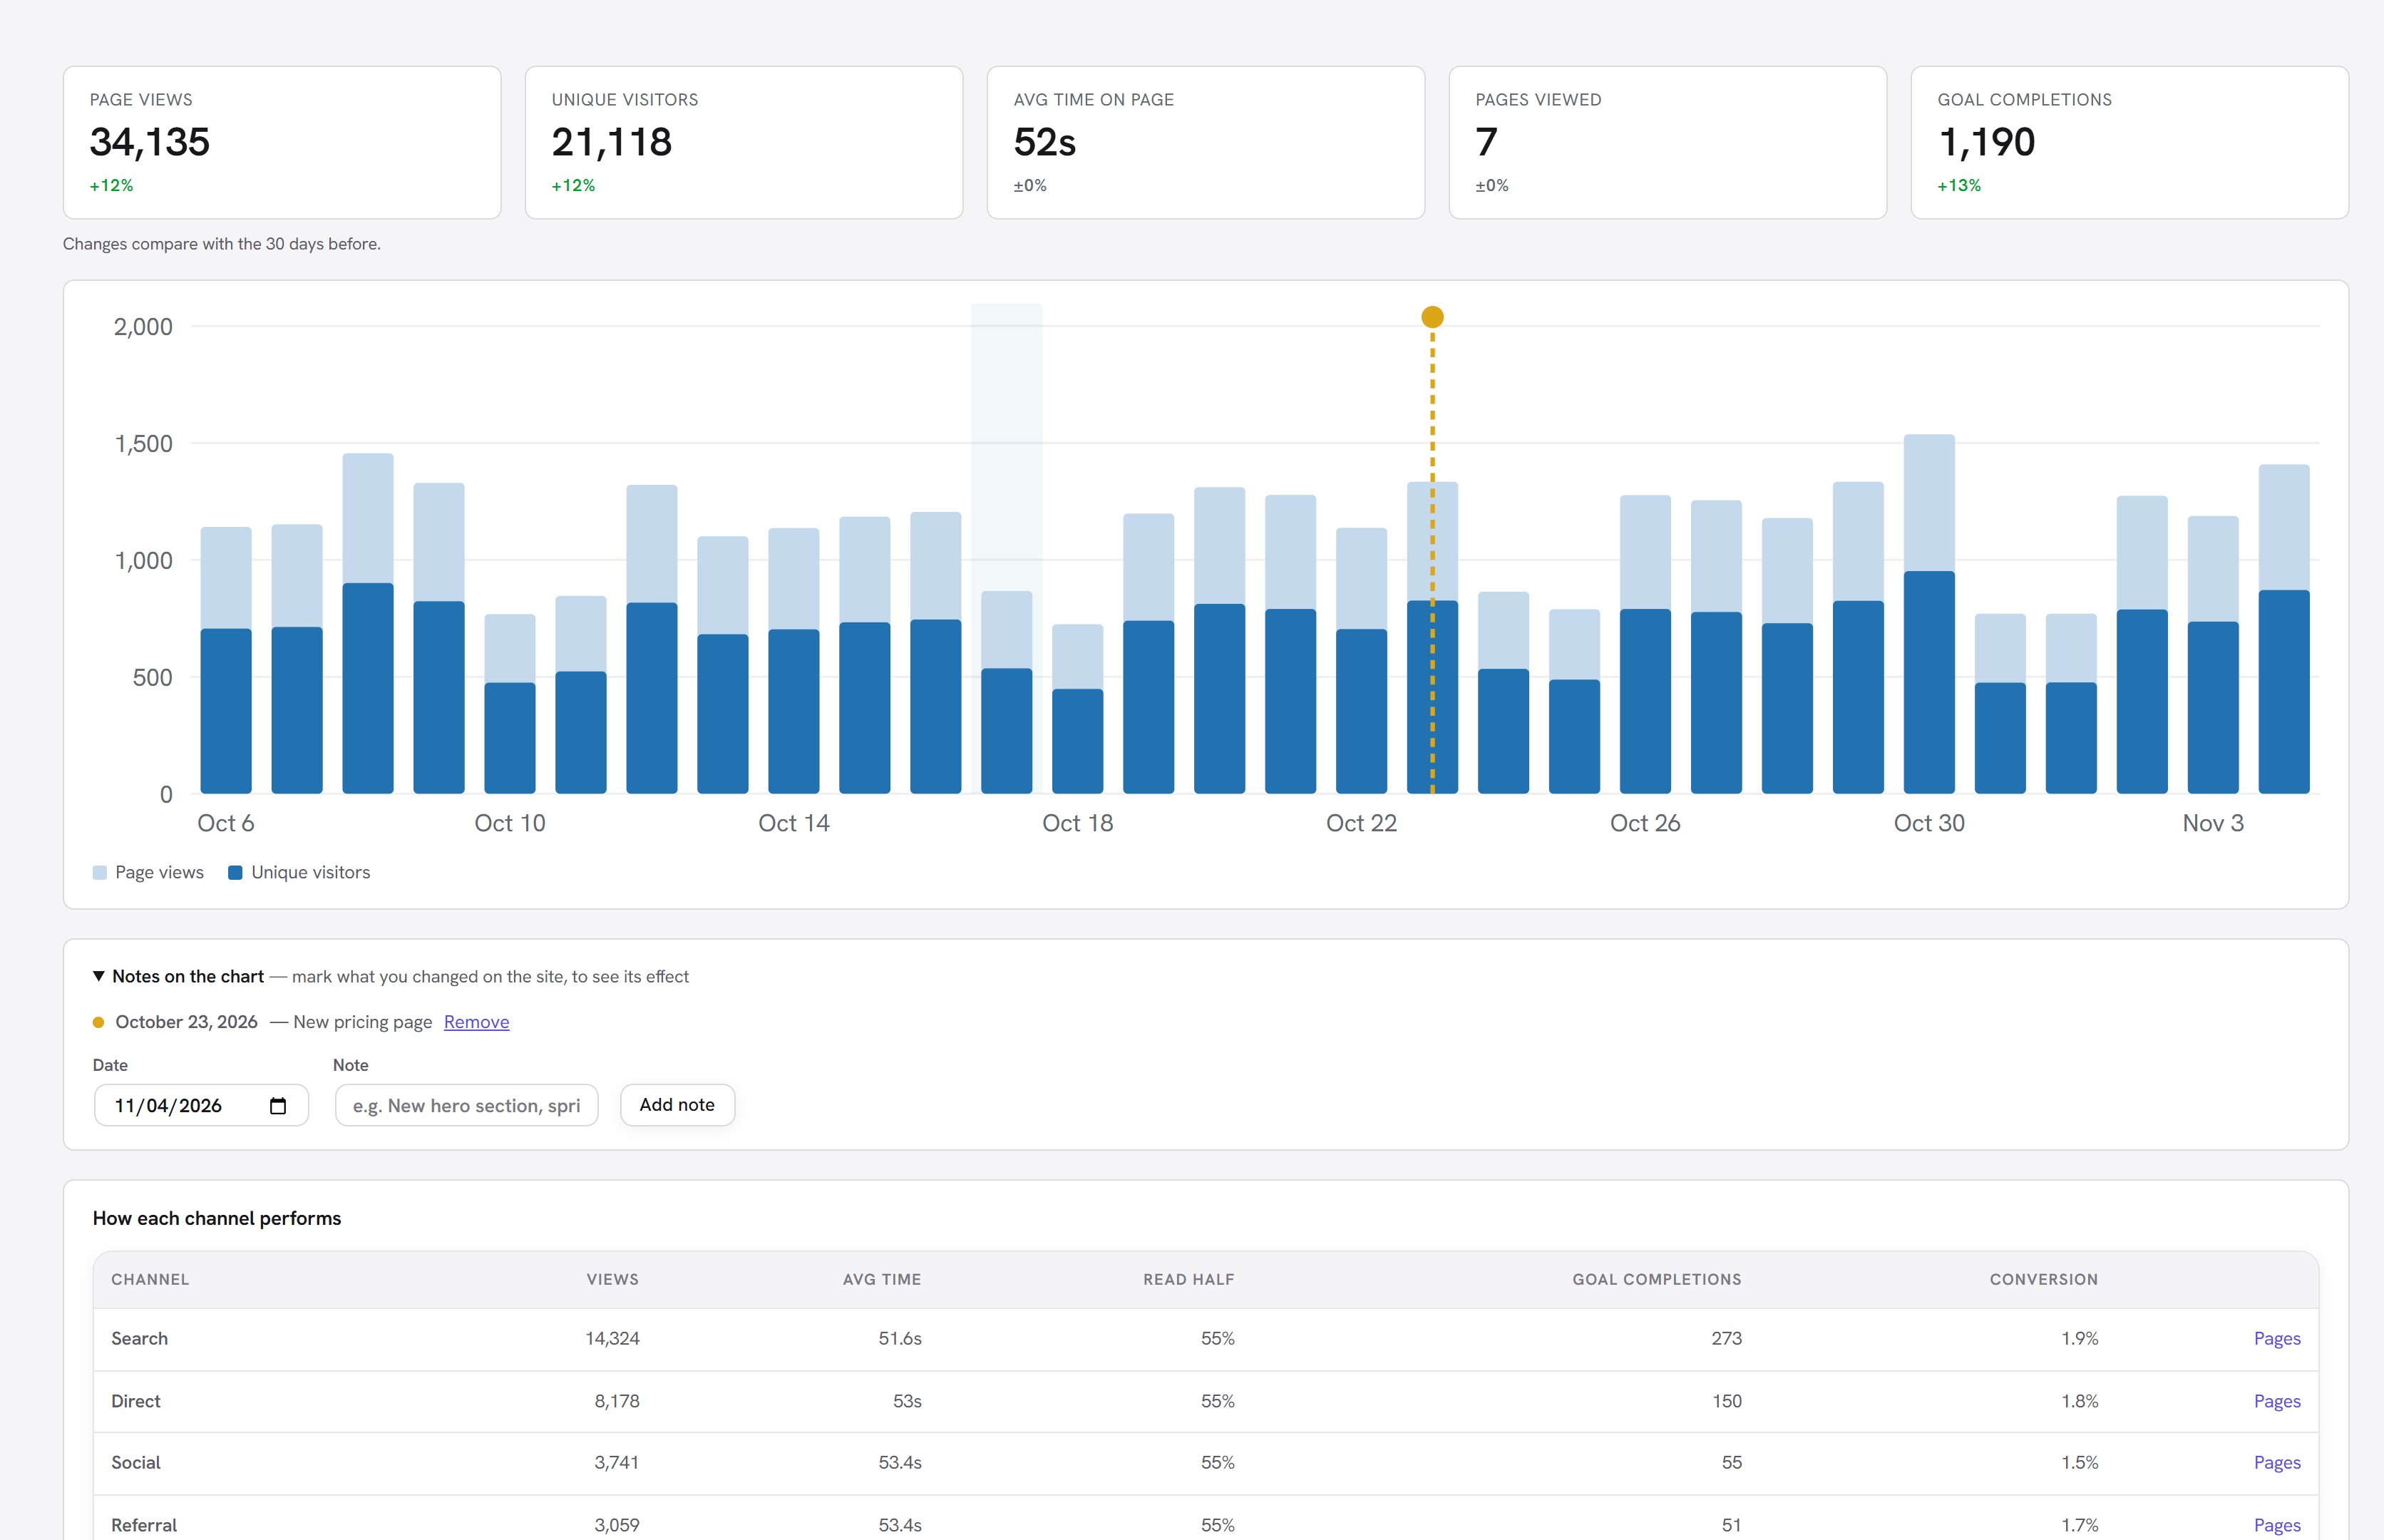
Below the chart are the top pages, referrers, campaigns, devices, browsers and countries.
What the numbers mean
| Figure | Meaning |
|---|---|
| Page views | Pages loaded by people. Bots are left out and counted separately. |
| Unique visitors | Different visitors on each day, added up across the period. Someone who comes back on three days counts three times, because a visitor is recognised only within a day. |
| Avg time on page | Time the page was visible while the tab was in front, not time left open in the background. |
| Goal completions | Everything counted under Goals. |
Channels
Every visit is put in one channel, from the referring site and any campaign tags on the link: Direct, Search, Social, AI assistants, Email, Paid, Campaign or Referral.
How each channel performs shows, per channel, the views, time on page, how many read half the page, goal completions and the conversion rate. Pages on a row opens the Pages view filtered to that channel, so you can see which pages its visitors land on.
Notes on the chart
Add a note for a redesign, a campaign or a price change, and it appears as a marker on that day. It is the easiest way to answer "what changed after we did that?". A site keeps up to 300 notes of up to 140 characters. You can also edit them in a spreadsheet.
Pages
Every tracked page with its views, visitors, time on page and how many read at least half of it, with each page's change against the period before. Filter by channel to re-rank the list by that channel's views.
Below the list are entry and exit pages: which pages visits start and end on, with the bounce rate of each entry page.
Everything about one page
Click a page's title for a report on that page alone:
- its trend, and how it compares with the period before;
- How visitors found this page: channels, keywords and referring pages;
- How visitors move through it: the pages they came from and went to next;
- What they did: goals completed there, exit links, downloads and forms;
- Who visited: devices and places.
Links at the top open its heatmap, its recordings and its editor.
Live
Page views in the last five minutes, by page. Use it to check a campaign the moment it goes out.
On your dashboard
A Visitor Insights widget on the WordPress dashboard shows the week against the one before, the last 14 days at a glance, the top pages and how many page views are happening right now.
Report downloads
Download CSV on the Overview and Pages views gives you Pages, Sources, Goals or Daily totals for the chosen period, ready for a spreadsheet or a client report.
These are totals for a period, so they are for reading only. To edit data or move it to another site, use Import / Export.